

Expected goals has transformed football analysis from subjective observation into quantifiable assessment. For Brentford specifically, xG data reveals patterns that traditional statistics obscure, creating betting opportunities invisible to bettors relying solely on results and basic metrics. Understanding how to interpret and apply xG analysis to Brentford fixtures separates modern analytical betting from outdated approaches that miss crucial information.
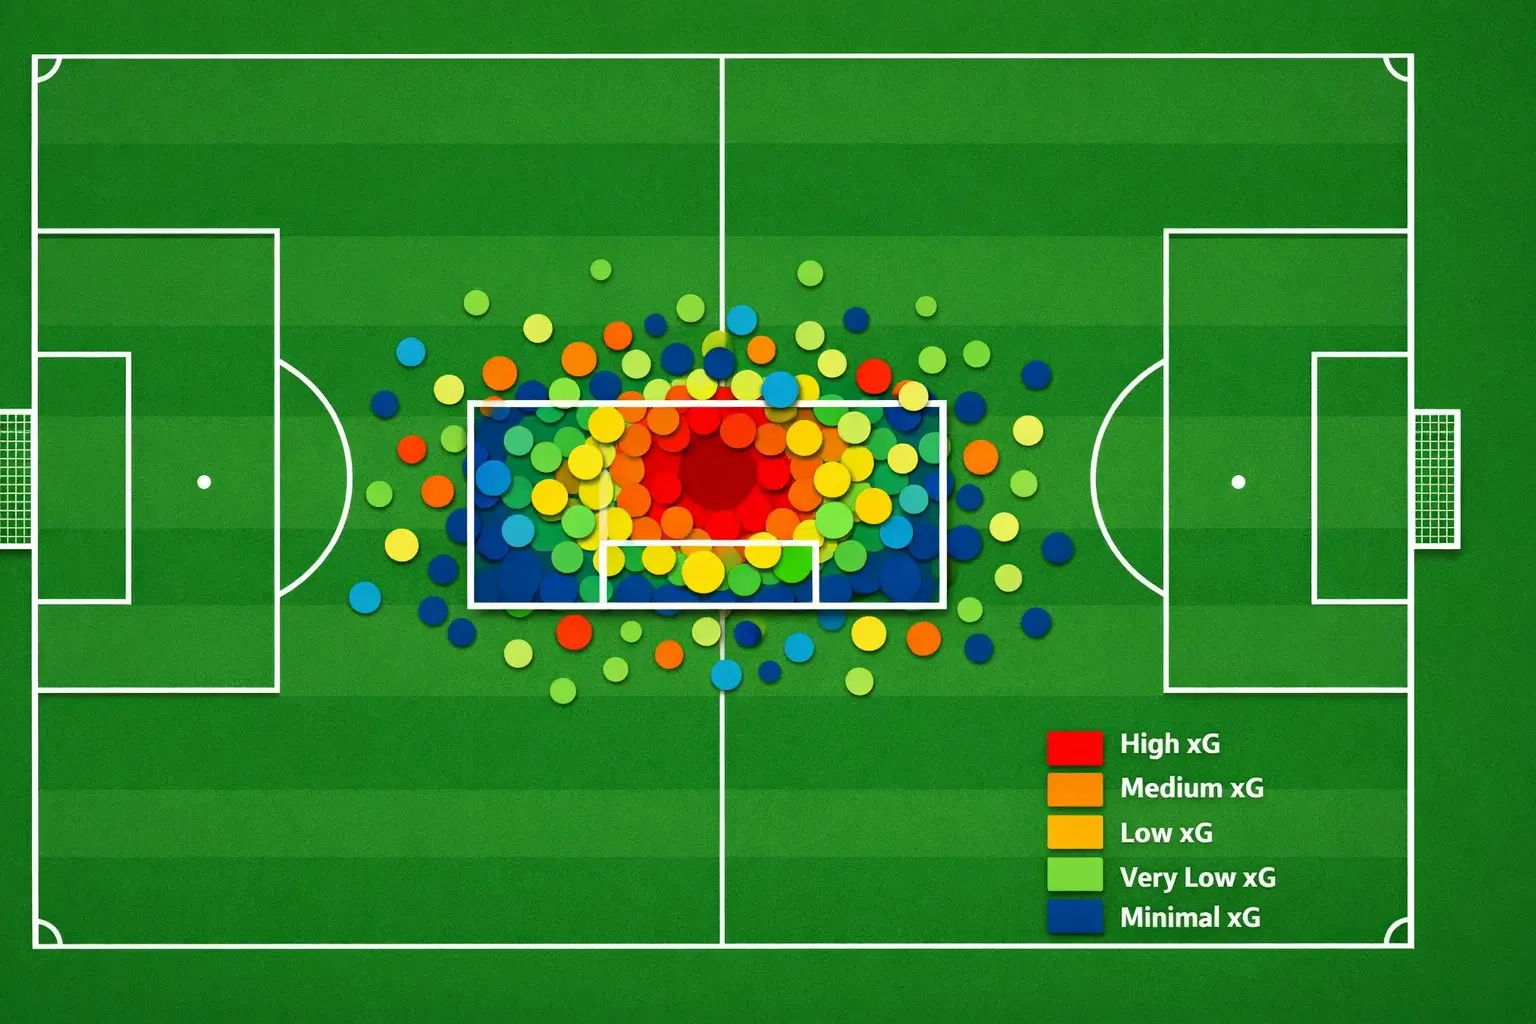
The fundamental concept behind expected goals measures chance quality rather than mere volume. Each shot receives probability weighting based on historical conversion rates from similar positions, accounting for factors like distance from goal, angle, body part used, and preceding action type. A tap-in from six yards carries higher xG than a speculative thirty-yard effort, reflecting genuine scoring likelihood rather than treating all shots equally.
Brentford’s relationship with xG proves particularly interesting among Premier League clubs. Their tactical approach specifically targets high-quality chances from optimal positions rather than accumulating shot volume. This philosophy generates distinctive xG profiles that inform betting decisions across multiple markets. Understanding these patterns enables more precise probability assessments than bookmaker pricing often reflects.
Brentford’s xG Profile Explained
Brentford consistently rank among Premier League leaders for xG per shot, meaning individual chances carry higher scoring probability than league average. During the 2026-25 season, they posted the division’s best xG per shot figure at 0.15, indicating each shooting opportunity averaged roughly 15% conversion expectation. This efficiency stems from tactical discipline prioritizing quality over quantity, taking fewer shots overall but ensuring those taken come from dangerous positions.
Their shot location data confirms this approach. Brentford take shots from closer to goal than almost any other Premier League team, averaging around 14.9 yards per attempt. This proximity results from patient buildup creating genuine goalscoring opportunities rather than speculative shooting that inflates volume without proportional goal production. The data validates their tactical philosophy while informing betting expectations about their scoring patterns.
Defensively, Brentford’s xG against profile shows interesting characteristics. They force opponents into lower-quality shooting opportunities, posting xG per shot conceded figures among the league’s best. Arsenal may have conceded fewer total goals during 2026-25, but Brentford actually gave opponents worse average shooting opportunities. This suggests defensive organization that limits opponent chance quality even while allowing more total shots than elite defensive units.
The relationship between actual goals and expected goals reveals important betting implications. Teams consistently outperforming xG likely experience positive variance that may regress. Teams underperforming suggest either bad luck due for correction or systematic finishing weakness. Brentford have shown remarkable xG alignment across seasons, scoring almost exactly what xG models predict, suggesting their goal output reflects genuine performance rather than variance. This stability supports confidence in xG-based predictions.
Applying xG to Match Betting
Pre-match xG projections inform result betting probability assessments. Various providers publish match-specific xG forecasts based on historical data and current form. When projected xG differential significantly exceeds what bookmaker odds imply, potential value exists on the team expected to create more quality chances. Comparing your xG assessment against market pricing reveals edges worth capturing.
For Brentford home fixtures, xG projections typically favor them by margins reflecting their home dominance. When models suggest 1.8 xG for Brentford against 1.2 xG for visitors, implied win probability should exceed what odds around 1.80-1.90 suggest. If bookmaker pricing implies lower win probability than xG differential warrants, value exists on Brentford victory. The analytical approach requires translating xG projections into probability estimates for comparison against market odds.
Away fixture xG assessments require acknowledging Brentford’s reduced road effectiveness. Their away xG drops significantly below home figures, reflecting tactical limitations in hostile environments. However, xG against also climbs on travels as opponents create better chances against Brentford’s away defensive vulnerabilities. These balanced reductions in both attack and defense sometimes create xG profiles suggesting more even matches than results-based analysis indicates.
Live xG tracking during matches enables dynamic betting adjustments. When Brentford dominate xG early without scoring, odds may drift unjustifiably as scoreless minutes accumulate. The underlying performance data suggests goals should arrive eventually, creating value on Brentford outcomes at inflated odds. Conversely, when opponents dominate xG despite Brentford leading, backing opponent comeback or match goals becomes attractive.
xG for Totals Markets
Expected goals data directly informs over/under betting through combined xG projections. When both teams’ xG forecasts sum above market totals lines, over bets capture value from models predicting more goals than pricing implies. Brentford fixtures frequently produce combined xG projections exceeding 2.5 goals, supporting over betting at appropriate odds.
Home fixtures particularly suit xG-informed totals betting. Brentford’s home xG typically approaches or exceeds 2.0, while visitor xG sits around 1.0-1.3 depending on opponent quality. Combined projections around 3.0-3.3 support over 2.5 betting when odds adequately compensate for the probability. Specific opponent xG profiles modify these baseline expectations, with attacking visitors boosting combined projections while defensive visitors compress them.
The xG approach to totals betting proves especially valuable when market pricing appears misinformed. If bookmakers price over 2.5 at 1.90 (implying 53% probability) but combined xG projections suggest 60%+ probability, genuine edge exists. Capturing these gaps consistently across fixtures generates long-term profit despite individual match variance. The analytical foundation provides confidence in selections that pure result observation couldn’t support.
Half-by-half xG distributions offer additional totals betting angles. Brentford’s first-half xG typically runs slightly below second-half figures despite their famous fast starts, because sustained second-half pressure generates consistent chance volume. Understanding these timing patterns informs first-half totals betting where markets often underestimate or overestimate based on reputation rather than actual data. Learn purely about btts betting analysis.
xG and Player Markets
Individual player xG data enables more precise goalscorer betting than reputation-based selection. Brentford’s attacking players show varying relationships between xG and actual goals, revealing who genuinely creates chances versus who merely finishes others’ creativity.
Bryan Mbeumo consistently outperforms his xG, demonstrating elite finishing ability that extracts more goals from chances than statistical expectation. His 2026-25 season saw him score 20 Premier League goals from approximately 13 xG, representing extraordinary overperformance of roughly +7 xG. This pattern suggests backing Mbeumo goalscorer props captures value when odds don’t fully account for his finishing superiority.
Yoane Wissa’s xG profile differs from Mbeumo’s. Wissa typically performs closer to xG expectations, meaning his goal output reliably reflects chance creation. When models project specific xG for Wissa in upcoming fixtures, his actual scoring should align reasonably closely. This predictability suits systematic goalscorer betting based on projected involvement rather than hoping for variance like Mbeumo provides.
Kevin Schade’s aerial prowess creates distinctive xG from headed chances that some models underweight. Traditional xG calculations may undervalue his header conversion rate, meaning his actual scoring sometimes exceeds projections. Backing Schade in headed goal markets captures this potential model blind spot when aerial opportunities seem likely against vulnerable defenses.

Practical xG Betting Framework
Implementing xG-informed betting requires reliable data sources and systematic process. Several providers publish xG data including Opta, Understat, and FBref, with varying methodologies producing slightly different figures. Consistency matters more than choosing the theoretically optimal model. Pick one source and track performance against it rather than cherry-picking favorable projections from multiple sources.
Pre-match preparation involves checking xG projections for upcoming Brentford fixtures and comparing against bookmaker pricing. When projections suggest probability gaps, note potential betting opportunities before odds move toward efficiency. Early-week analysis often reveals value that disappears by matchday as market correction occurs.
In-play xG tracking through live data feeds enables real-time betting adjustment. Services providing live xG updates allow monitoring whether match flow supports pre-match projections. When actual xG accumulates ahead of projections, live odds may offer better value than pre-match pricing did. When xG lags projections, patience or position adjustment becomes appropriate.
Results tracking should include xG comparison alongside actual outcomes. Recording both actual scorelines and underlying xG reveals whether selections were analytically sound even when results disappointed. Luck-adjusted performance assessment prevents abandoning profitable strategies after variance-driven losing streaks while identifying genuinely flawed approaches requiring revision.
Expected goals analysis transforms Brentford betting from results-chasing into probability assessment grounded in quantifiable performance data. Their distinctive tactical approach creating high-quality chances from optimal positions generates xG profiles that inform betting across result, totals, and player markets. Success requires consistent data source usage, systematic comparison against market pricing, and honest performance tracking that separates analytical edge from random variance. The effort investment pays dividends through identification of value invisible to traditional analysis approaches. Claim bigger weekend returns at brentford bet.
