


Value betting requires comparing your probability assessment against bookmaker odds to identify mispricing. For Brentford specifically, understanding where markets typically misprice their fixtures enables systematic value identification that opportunistic betting cannot achieve. Developing reliable probability assessment skills and odds evaluation processes transforms Brentford betting from speculation into analytical exercise.
The fundamental value equation compares implied probability from odds against your estimated true probability. Odds of 2.00 imply 50% probability. If your analysis suggests 55% true probability, positive expected value exists because you’re betting at odds implying lower probability than you believe applies. Capturing these gaps consistently generates long-term profit despite individual match variance.
Bookmakers price Brentford fixtures using historical data, market models, and liability management that may not perfectly reflect current reality. Understanding systematic biases in how markets price Brentford creates opportunity for bettors whose analysis corrects these biases. Identifying where and why mispricing occurs improves value identification efficiency.
Converting Odds to Probability
Mastering odds-to-probability conversion enables direct comparison against your assessments. Decimal odds convert simply: divide 1 by the decimal odds. Odds of 2.50 become 1/2.50 = 0.40 or 40% implied probability. Fractional odds require adding 1 to convert: 3/1 becomes 4.00 decimal, then 1/4.00 = 25% implied probability.
Bookmaker margins inflate total implied probability beyond 100%. A market with outcomes at 1.90, 3.60, and 4.50 implies 52.6% + 27.8% + 22.2% = 102.6%. The 2.6% represents bookmaker edge extracted from bettors. Fair odds would sum to exactly 100%. Recognize that beating this margin requires probability assessments accurate enough to overcome the built-in house advantage.
For Brentford match betting, typical home fixture might show: Brentford 1.85 (54%), Draw 3.50 (29%), Away 4.50 (22%) totaling 105%. Removing margin proportionally suggests true implied probabilities around Brentford 51%, Draw 27%, Away 21%. Your assessment must exceed these margin-adjusted probabilities for value to exist.
Compare your probability assessment against both raw implied probability and margin-adjusted probability. When your estimate exceeds margin-adjusted probability but falls below raw implied probability, value exists but margin erosion reduces expected return. When your estimate exceeds even raw implied probability, stronger value justifies increased confidence.
Where Markets Misprice Brentford
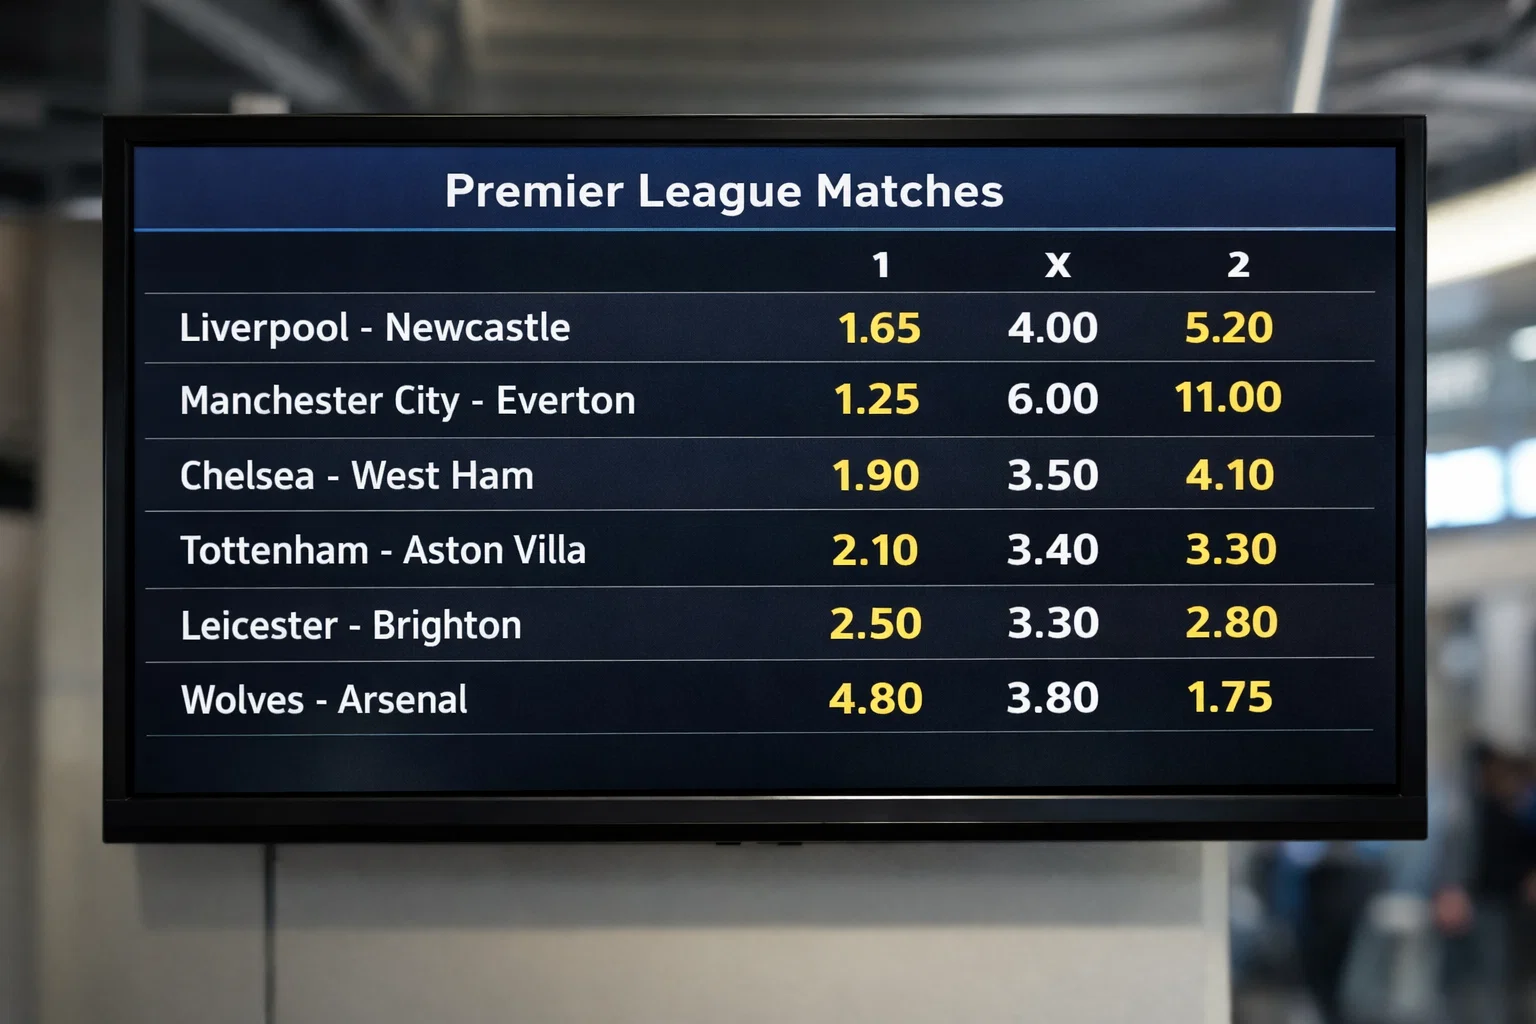
Certain systematic biases affect Brentford odds pricing worth understanding. Markets sometimes overweight recent results at the expense of underlying performance. A Brentford losing streak might depress their odds beyond what xG and chance creation data justify. Recognizing when results lag underlying performance identifies value from regression toward expected outcomes.
Home advantage quantification sometimes proves imprecise for smaller clubs. Brentford’s home dominance at the Gtech may exceed what generic home advantage models suggest. If your analysis indicates stronger home edge than market pricing implies, systematic home fixture value exists throughout the season.
Opponent reputation effects can distort pricing. Markets sometimes assume Big Six superiority will manifest regardless of specific circumstances. When Big Six visitors arrive at Brentford in poor form, amid fixture congestion, or missing key players, markets may still price based on generic reputation rather than current reality. These situational disconnects create value on Brentford outcomes.
Set-piece factors receive inconsistent market weighting. Brentford’s elite set-piece record both attacking and defending should increase their win probability and decrease goals conceded probability. Markets that don’t fully incorporate this factor misprice fixtures where set-pieces prove decisive.
Developing Probability Assessment Skills
Accurate probability assessment requires systematic analysis rather than intuitive guessing. Build assessment frameworks that consider multiple factors: current form, head-to-head history, home/away splits, team news, tactical matchups, and motivation. Weight each factor based on demonstrated predictive relevance.
Record your probability assessments before checking market odds. This discipline prevents anchoring bias where seeing odds first influences your supposedly independent assessment. Genuine value identification requires assessment independence from market pricing.
Track assessment accuracy over time. Compare your pre-match probability estimates against actual outcomes across many fixtures. If you consistently overestimate Brentford win probability, calibrate assessments downward. If you consistently underestimate, adjust upward. Calibration improves accuracy toward probabilities that match real outcome frequencies.
Distinguish confidence from probability. High confidence in 60% probability differs from uncertain 60% assessment. Both estimates are 60%, but your underlying certainty differs. Consider position sizing based on assessment confidence alongside expected value calculations. Enforce rigid bankroll management rules.
Line Shopping Across Bookmakers
Different bookmakers offer different odds on identical outcomes. Brentford at 1.95 with one bookmaker versus 1.85 elsewhere represents significant value difference on identical bet. Maintaining accounts across multiple platforms enables capturing best available odds rather than accepting inferior pricing.
Odds comparison sites aggregate pricing across bookmakers for easy shopping. Before placing any Brentford bet, check comparison sites to identify best available odds. The few minutes spent shopping often captures 5-10% better pricing that compounds into meaningful long-term profit improvement.
Some bookmakers consistently offer better odds on specific market types. Identify which bookmakers tend to price Brentford favorably for match results, totals, and goalscorer markets respectively. Default to checking those bookmakers first for relevant selections while still verifying against competitors.
Early-week odds sometimes differ from matchday pricing. Sharp bettors often bet early when value exists, moving lines toward efficiency by kickoff. Conversely, public money closer to matches sometimes creates late value on less popular selections. Monitor how Brentford odds move across the week to identify optimal betting timing.
Tracking and Reviewing Performance
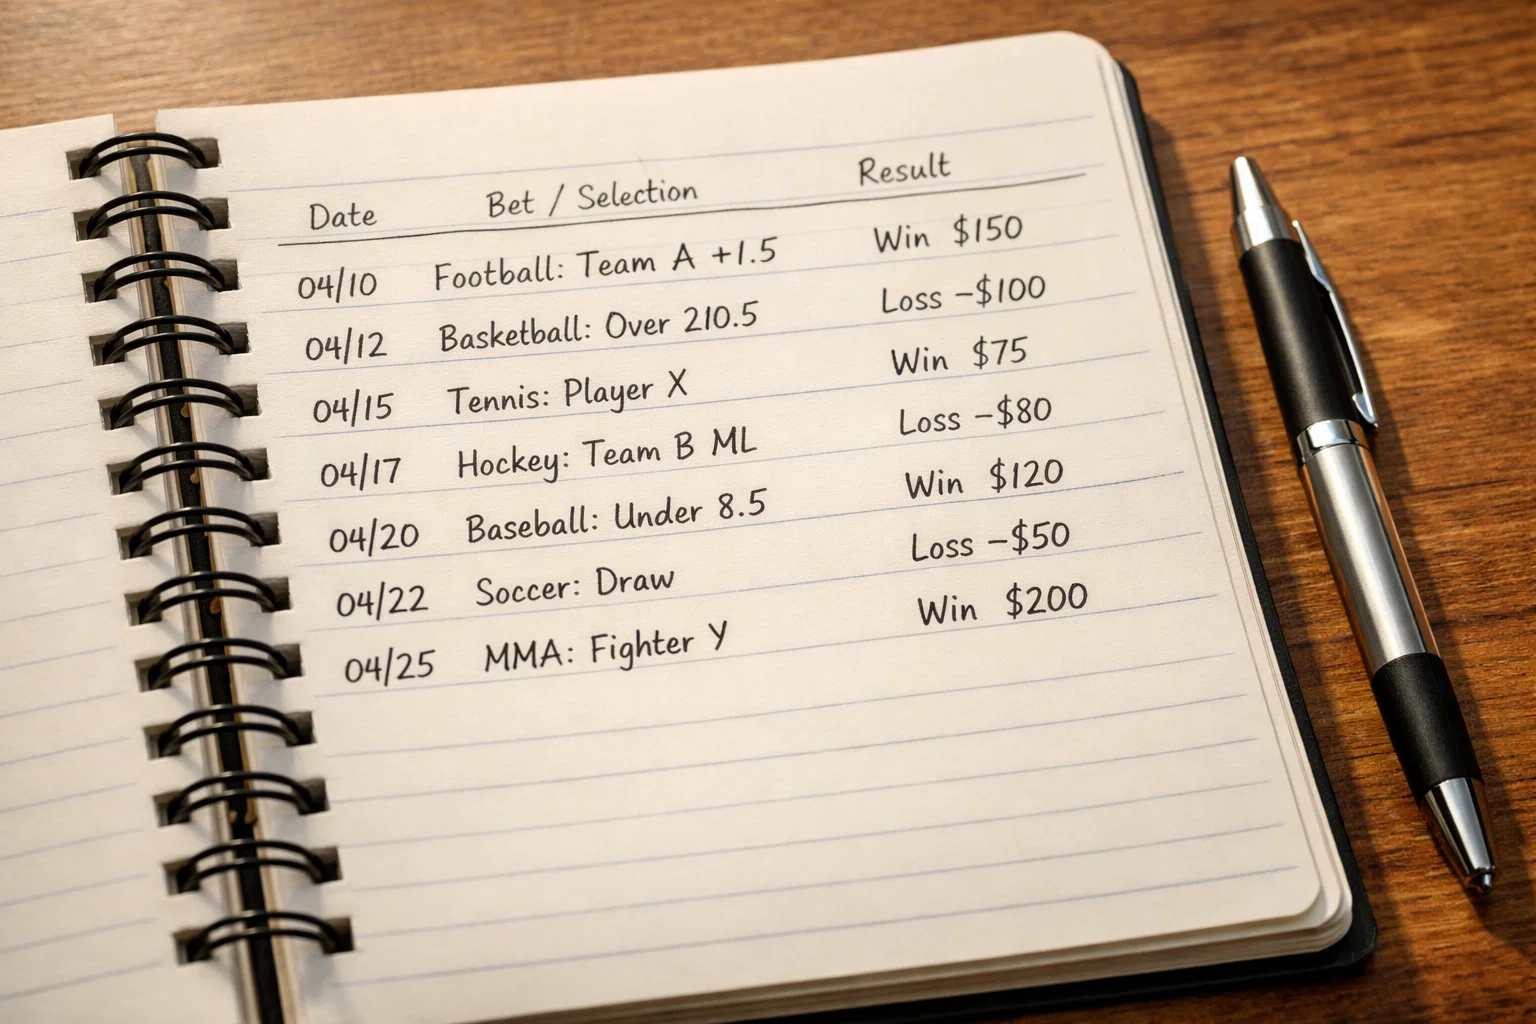
Systematic performance tracking reveals whether your Brentford betting actually generates edge. Record every bet including stake, odds, outcome, and reasoning. Calculate actual return on investment across meaningful sample sizes to assess genuine profitability.
Review losing bets specifically to identify error patterns. Did losses reflect analytical mistakes correctable through improved process? Did losses reflect bad luck affecting correct decisions? Distinguishing these categories enables targeted improvement efforts.
Compare your performance against closing line movement. If your selections consistently move toward your direction between your bet and kickoff, sharp money agrees with your assessment. If lines consistently move against you, the market eventually disagrees, suggesting analytical improvement needs.
Periodically reassess your Brentford betting approach entirely. Markets evolve, team dynamics change, and previously profitable patterns may stop working. Remaining adaptable while maintaining analytical discipline balances consistency with necessary evolution.
Value Thresholds and Position Sizing
Not all value warrants betting. Minor value of 1-2% expected edge barely overcomes transaction costs and uncertainty. Set minimum value thresholds before betting. Perhaps require 5%+ expected edge for standard selections, 10%+ for enhanced confidence warranting larger positions.
Position sizing should reflect both expected value magnitude and assessment confidence. Large expected value with high confidence warrants maximum allocation within bankroll management limits. Smaller edge or uncertain assessment suggests reduced stakes despite positive expectation.
Avoid betting perceived value when assessment uncertainty runs high. Better to miss marginally positive opportunities than bet confidently on uncertain assessments. Discipline in bet selection preserves capital for highest-confidence opportunities where value seems clearest.
Kelly criterion provides mathematical framework for optimal position sizing based on edge and odds. Full Kelly often proves too aggressive for practical use, but fractional Kelly approaches offer principled sizing that accounts for both edge magnitude and inherent uncertainty. Research these approaches for systematic position sizing improvement.
Value identification transforms Brentford betting from outcome prediction into edge calculation. Systematic comparison of your probability assessments against market-implied probabilities reveals mispricing worth capturing. Success requires accurate assessment development, disciplined odds shopping, and position sizing that reflects both edge magnitude and assessment confidence. The analytical approach generates consistent long-term returns that intuitive betting cannot match. Stop guessing blind and start analyzing with brentford bet.
